


Lumen V4, 2014, Visegrád, Hungary
Improving Colour Vision
K. Wenzel, A. Urbin
Department of Mechatronics, Optics and Mechanical Engineering Informatics
Budapest University of Technology and Economics,
1111Budapest, Bertalan Lajos út 4-6.
Abstract
In Europe, 8% of the male population suffers from colour vision deficiency. This condition does not only hinder their professional career in more than a hundred professions where they are disadvantaged, but may also results in minority complex, anxiety or inhibitions. Being an inherited genetic disorder, colour vision deficiency cannot be cured, yet it may be improved by colour boosting eyeglasses featuring special filters. We show the results of a test that was conducted on 20 colour anomalous subjects. All subjects had been examined first with an anomaloscope. The test was conducted using the Ishihara, Farnsworth Panel D15 and Colorlite tests, using a standard CIE D65 light source. Tests were first completed without colour boosting eyeglasses in all three cases, than all they were repeated using the colour boosting eyeglasses. Test results showed that all test subjects performed all the tasks better wearing the eyeglasses than without eyeglasses.
Introduction

The inability to distinguish between red and green colours is a gender-specific inherited visual impairment. Colour vision deficiency has an X-linked inheritance and is generally manifested in men. A total of 8 per cent of European men and just 0.5 per cent of European women live with colour vision deficiency [1, 2, 3]. There are 20 million colour vision deficient in the European Union, and some 12 million in the USA (Figure 1).
Colour vision deficiency can be a limiting or excluding factor in over 100 lines of work. In our age, most lines of work require good colour vision. The difference between the colours, or colour contrast of surfaces can be boosted when observed through special colour filters. These colour filters, when used as lenses for eyeglasses or contact lenses, improve the colour discrimination and colour perception of patients with colour vision deficiency.
Optical description of the function of the colour boosting eyeglasses
Generally, the effect of a colour filter on colour perception can be described [4] according to formula (1) and (2):
F1 (λ) = Fe(λ)*r(λ) (1)
Where F1(λ) is the spectral performance distribution of the light source that illuminates the coloured surface, Fe(λ) is the spectral performance distribution of light reflected from the coloured surface if no colour filter is placed in its way and r(λ) is the spectral reflection of the coloured surface;
F2 (λ) = Fe(λ)*r(λ)* t(λ) (2)
Where, F2(λ) is the spectral performance distribution of light reflected from the coloured surface if a colour filter is placed in the light’s way and τ(λ) is the spectral transmission of the colour filter.
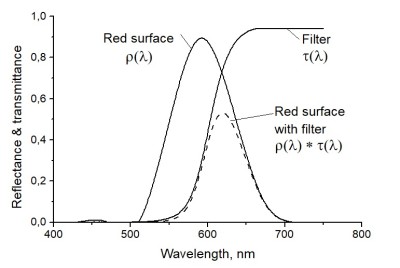
Without colour filter, the colour of the coloured surface is described by r(λ) spectral reflection. If a t(λ) spectral transmission colour filter is placed in the way of the light falling on or reflected from the surface, the spectral performance distribution of the light reflected from the surface will change, according to formula (2), to F2 (λ). Thus, when the colour filter is used, the colour of the surface is modified by the colour filter and therefore it will take on the appearance of r(λ)*t(λ) spectral reflection.
Figure 2.shows the effect of a colour filter with a t(λ) transmission rising towards the longer wavelengths on the t(λ) spectral transmission of a red colour surface. We can see that the shape of the spectral reflection curve describing the surface’s colour did not change substantially, while its apex shifted to the right, that is in the direction of the spectrum where the values of the filter’s transmission curve increase. Naturally, because of the use of the colour filter, the values of the reflection curve that describe the surface’s colour are lower in absolute terms than without the use of the colour filter, because colour filters always emit less light than the amount they admit.
It is also possible to design a colour filter, which increases the distance between the spectral performance curves of the light reflected from different colour surfaces, and thus increases the difference between the different colours (Figure 3.).
 spectral transmission of a colour boosting filter")
The t(λ) spectral transmission of the colour filter is shown in Figure 3. increases to the right in the longer wavelength segments of the spectrum, while it increases to the left in the shorter wavelength segments. Thus, it shifts the spectral performance curve of light reflected from a red colour surface to the right, while it shifts the spectral performance curve of light reflected from a blue colour surface to the left. As a result, the spectral difference between the two colours (colour difference) increases. Therefore, we may call this filter a “colour boosting filter”.
In the segment of green hues, the filter’s spectral transmission shows nearly constant values and, as a result the spectral performance curve of light reflected from the green surface shifts only slightly, in the direction of either the shorter or the longer wavelengths.
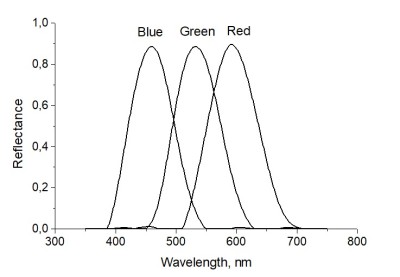
Using formula (1) and (2), we described the effect of the filter with the spectral transmission shown in Figure 4. on the colours of blue, green and red colour surfaces. Figure 4 shows the spectral reflection of blue, green and red colour surfaces without the use of a colour filter, while Figure 5. shows the same colours with the reflection spectrum when observed through a colour boosting filter.
When viewed through a colour boosting filter, the apexes of the spectral reflection curves (rmax) of the red, green and blue coloured surfaces are displaced. The wavelengths of the apexes with and without colour filter are summarised in Table 1.
|
λrmax, nm |
|||
|
Red surface |
Green surface |
Blue surface |
|
|
Without colour boosting filters |
596 |
536 |
462 |
|
With colour boosting filters |
617 |
540 |
443 |
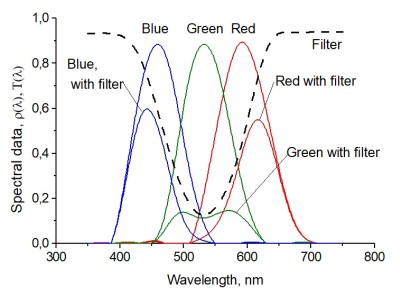
The spectral performance of the reflected light was reduced slightly as a result of the use of the colour filter for all three colours. This reduction, however, is set within minutes by the eye’s light and colour adaptation. The greatest reduction in reflection is seen in on green surfaces, because the spectral transmission of the relevant colour filter is lowest in the green spectrum segment. At the same time, the spectrum segment of green colour seems slightly wider when viewed through the filter, therefore green hues do not appear much darker through the filter than the red or blue ones. Further, the eye’s colour adaptation offsets this difference too, when the filter is held before the eyes for 1-2 minutes.
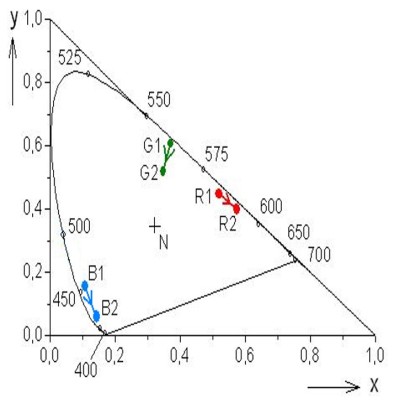
The colour points for unfiltered and filtered colours in the CIE chromaticity diagram within the x, y coordinate axes are illustrated by Figure 6. In the figure, the points R1, G1 and B1 are the colour points of the colours of the surface used in the tests without a filter whereas R2, G2 and B2 are the ones perceived when using the filter. The CIE x, y colour coordinates are summarized in Table 2.
Figure 6 shows that the colour point of red shifts towards the typical 700 nm wavelength of purest red, while the colour point of blue shifts towards the typical 400 nm wavelength of the purest violet-blue. Red therefore appears to be redder while blue bluer through the colour boosting filter. The colour point of green shifts towards the neutral colour point N (x=1/3, y=1/3) and therefore appears a little more faded, less saturated through the filter, but the change to its hue is negligible.
The increased difference between colours renders colour discrimination easier, for both those with normal colour vision, and those with a colour vision deficiency. This offers an advantage particularly to those with a colour deficiency, because their ability to discriminate between colours is weaker than that of those with normal colour perception.
|
Colour |
x |
y |
z |
|
|
Without colour boosting filters |
R1 |
0.5209 |
0.4712 |
0.4792 |
|
G1 |
0.2772 |
0.6022 |
0.5494 |
|
|
B1 |
0.1371 |
0.0941 |
0.1046 |
|
|
With colour boosting filters |
R2 |
0.5920 |
0.3996 |
0.1770 |
|
G2 |
0.3282 |
0.5094 |
0.1108 |
|
|
B2 |
0.1483 |
0.0464 |
0.0310 |
Optical qualities of colour boosting eyeglasses
Filters for colour boosting eyeglasses are manufactured by Colorlite Ltd. Budapest. The glasses are available in about 30 cities in Hungary, and in Poland, Slovakia, Croatia, Germany, Turkey, France, Romania and Serbia in one optical shop.
Filters are manufactured by means of thermo-diffusion using CR39 plastic as a carrier. Filters may be
manufactured with or without dioptries. Hard film, water-repellent film or polarization film, etc. cannot be applied. The average transmission of the filters in the entire visible spectrum (from 380 nm to 700 nm) is about 55% that is their effect is similar to mildly tinted sunglasses (Figure 7).
Our tests conducted on over 1000 people with colour vision deficiency yielded an interesting observation. Different colour deficient persons may be helped by filters with the same spectral characteristic but in a different part of the spectrum. This is presumably due to the extent to which their receptor sensitivity curves digressed from those with normal colour vision. So we have different filters for different types of colour vision deficiency [5].
In 2001, the Frankfurt Chiltern International GmbH, with the participation of the State University of New York (State College of Optometry, University Optometric Center), Sote I. Szemklinika (Sote Eye Clinic I) and the Honvéd Kórház Szemészet (Honvéd Hospital Optometry) conducted a successful CRO (Chlinical Research Organization) test on these eyeglasses.
The Magyar Egészségügyi Engedélyezési Hivatal Orvostechnikai Igazgatósága (Medical Technology Directorate of the Hungarian Health Licensing Office) issued a certification (Reg. No. 3100/2004) that, under ISO 15225:2000, the colour vision correction eyeglasses may be marketed under the C€ logo as medical optical equipment. The registration code is HU/13060657-2-43.
Testing the effect of Colorlite eyeglasses – methods and instruments
The test was conducted on 20 colour anomalous subjects. All subjects had been examined with an anomaloscope. The test was conducted using the Ishihara, Farnsworth Panel D15 and Colorlite tests, using a standard CIE D65 light source [6]. We used diffuse light of 700 lux [7]. Tests were first completed without eyeglasses in all three cases, than all they were repeated using the colour boosting eyeglasses. 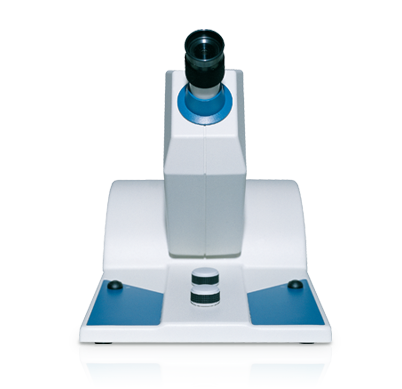
Anomaloscope
The examination was conducted with a Heidelberg anomaloscope made by Oculus (Figure 8). During the examination, the test leader set the R/G value from 0 to 73, by steps of 10 units at a time, and the test subject had to set Y values that seemed to correspond to these in terms of brightness. After mapping the entire segment, the test subject had to identify the points of exact correspondence
Ishihara test
Ishihara’s tests for colour deficiency, 24 Plates Edition, 1999, Kanehara&Co., Tokyo, Japan, Figure 9 has pseudoisochromatic plates (Figure 9).
The examination was conducted with the use of a standard CIE D65 light source. Each subject had to recognize the same 20 digits in the same order. (Double-digit numbers were considered as two distinct numbers.) Unlimited time and calm surroundings were provided for reading.
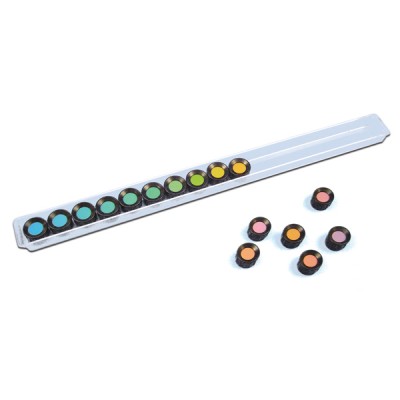
Farnsworth Panel D15 test
The Farnsworth Panel D15 test (D15 test, for short) uses 15 caps of different colours, which should be ranked according to colour by the test subject (Figure 10). One of the ways of evaluating the results of the Farnsworth Panel D15 test is to calculate the error value (Confusion Index, CI). An online method for the calculation of the confusion index was developed by Török. The results presented in Table 3. were calculated using this method. The confusion index for a perfect ranking is 1 and C ≥ 1, when the ranking contains errors. The greater CI is, the more errors there are in the ranking.
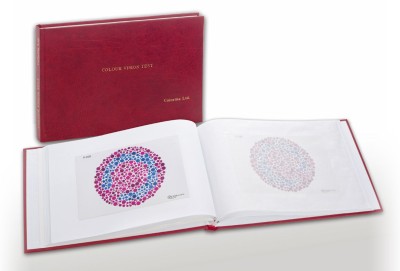
Colorlite test
We have developed a test called Colorlite test in order to examine the ability of colour discrimination [8]. The test consists of three series of increasingly difficult printed pseudo-isochromatic plates (Figure 11).
Test subjects
20 people with colour vision deficiency (4 protanomalous, 2 protanope, 5 deuteranomalous and 9 deuteranope parcipitans, diagnosis obtained with anomaloscope) were examined, with and without the colour boosting eyeglasses. The test subjects were between 7 and 48 years old. They were all males.
Measures
Test results are detailed in Table 3.
|
No. |
Age |
Anomaloscope result |
Colorlite lenses |
Recognized Ishihara plates from 20 number) |
Farnsworth Panel D15 test, confusion index |
|||||
|
R/G |
AQ |
Y |
Diagnosis |
Without glasses |
With glasses |
Without glasses |
With glasses |
|||
|
01 |
20 |
0…73 |
∞-0 |
19.0-17.0 |
Deuteranop |
D15 |
14 |
20 |
3,72 |
1,50 |
|
02 |
12 |
40.0 |
1.0 |
15.0 |
Deuteranomal |
D20 |
4 |
20 |
3,68 |
1,00 |
|
03 |
33 |
0…73 |
∞-0 |
34.0-2,8 |
Protanop |
P25 |
5 |
20 |
4,39 |
1,00 |
|
04 |
48 |
0…73 |
∞-0 |
20.6-12.5 |
Deuteranop |
D10 |
2 |
20 |
3,91 |
1,00 |
|
05 |
36 |
64.4 |
0.16 |
7.2 |
Protanomal |
P20 |
6 |
20 |
1,00 |
1,00 |
|
06 |
42 |
17.3 |
3.94 |
16.8 |
Deuteranomal |
D20 |
1 |
20 |
1,06 |
1,00 |
|
07 |
46 |
50.0 |
0.55 |
18.5 |
Protanomal |
D10 |
7 |
20 |
4,07 |
1,97 |
|
08 |
36 |
10.0 |
7.62 |
19.5 |
Deuteranomal |
D20 |
5 |
20 |
3,49 |
1,00 |
|
09 |
22 |
0…73 |
∞-0 |
16.4-16.6 |
Deuteranop |
D20 |
4 |
20 |
3,31 |
1,00 |
|
10 |
14 |
0…73 |
∞-0 |
19.1-14.8 |
Deuteranop |
D20 |
3 |
19 |
3,55 |
1,00 |
|
11 |
7 |
0…73 |
∞-0 |
16.8-14.6 |
Deuteranop |
D20 |
4 |
18 |
3,56 |
1,48 |
|
12 |
16 |
0…73 |
∞-0 |
17.8-1.6 |
Protanop |
P30 |
3 |
20 |
4,36 |
1,00 |
|
13 |
45 |
0…73 |
∞-0 |
19.1-14.5 |
Deuteranop |
D15 |
6 |
19 |
3,74 |
1,00 |
|
14 |
40 |
73.0 |
0 |
4.5 |
Protanomal |
P25 |
4 |
20 |
2,49 |
1,00 |
|
15 |
34 |
65.0 |
0.15 |
6.0 |
Protanomal |
P25 |
2 |
18 |
1,12 |
1,00 |
|
16 |
26 |
0…73 |
∞-0 |
16.4-14.1 |
Deuteranop |
D20 |
2 |
20 |
3,57 |
1,06 |
|
17 |
20 |
0…73 |
∞-0 |
20.6-10.9 |
Deuteranop |
D15 |
5 |
20 |
3,44 |
2,96 |
|
18 |
34 |
18.0 |
3.69 |
18.2 |
Deuteranomal |
D15 |
7 |
20 |
3,18 |
1,00 |
|
19 |
18 |
16.3 |
4.21 |
17.0 |
Deuteranomal |
D20 |
4 |
19 |
1,65 |
1,00 |
|
20 |
30 |
0…73 |
∞-0 |
18.5-12.0 |
Deuteranop |
D30 |
3 |
20 |
1,06 |
1,00 |
|
Mean |
- |
- |
- |
- |
- |
4.55 |
19.65 |
3.02 |
1.20 |
|
Discussion
- Table 3. presents the data for 4 protanomalous, 2 protanope, 5 deuteranomalous and 9 deuteranope males. This sample is not considered representative regarding the distribution of colour vision deficiency types, because we tested only volunteers.
- All subjects were identified as colour vision deficient.
- Table 3. shows that almost all colour vision deficient test subjects recognised at least 18 digits of the Ishihara test when wearing colour boosting eyeglasses. Without the eyeglasses, an average 4.55 of the digits were recognised, as opposed to 19.65 with the eyeglasses.
- The Confusion Index (CI) calculated for the Farnsworth Panel D15 test rose from the average 3.02 to an average of 1.20, in other words, almost all test subjects performed the task with fewer errors.
- The ability to discriminate between colours also improved substantially. While the typical R-G value of colour discrimination was 190 colour difference units in the Colorlite test without the glasses, with the eyeglasses the average value was 34. This means that test subjects almost scored as low as R-G=30, a value typical of those with normal colour vision.
- In 4 cases, test subjects without colour boosting eyeglass solved the Farnsworth Panel D15 test without error although in every other test they were proven to be colour vision deficient (these were subjects 05, 06, 15 and 20).
- Colorlite eyeglasses have a beneficial effect on the colour perception of the colour vision deficient. Substantial improvement could be shown in Ishihara, Farnsworth Panel D15 and Colorlite test results, as a result of the eyeglasses.
- Today several hundred people with colour vision deficiency wear the Colorlite eyeglasses for work, fun and sport. No unfavourable side-effects (dizziness, headache, eye inflammation, etc.) have been reported, and, conversely, many users reported favourable effects. They saw the world in more colour, they were calmer, more self-confident. Improved reading and learning results were also reported.
- The regular use of colour boosting eyeglasses improved colour vision to a small degree even when not worn. The reason behind this may be that users of the eyeglasses may learn to pay more attention to colours than they had done before.
References
[1] J. Nathans, T.P. Piantanida, R.L. Eddy. et al: Molecular genetics of inherited variation in human colour vision. Science(1986), pp. 203-210.
[2] R. Fletcher, J. Voke: Defective Colour Vision. Adam Hilger Ltd, Bristol and Boston(1985)
[3] K.R. Gegenfurtner, L.T. Sharpe:Color Vision from Genes to Perception. Cambridge UniversityPress(1999)
[4] K. Wenzel: A színeslátásmodellezése – Méréstechnikaialkalmazásokkal. Kandidátusiértekezés, Budapest (1991)
[5] Gy. Ábrahám, J. Szappanos, K. Wenzel: Method and optical means for improving or modifying colour vision and method for making said optical means. Patent No. 0770 6-PCT (1993)
[6] J. Pokorny, V.C.Smith, G. Verriest, A.J.L. Pinckers: Congenital and Acquired Color Vision Defects. Grüne& Stratton, New York(1979)
[7] J. Birch: Diagnosis of Defective Colour Vision. Butterworth- Heineman (1993)
[8] K. Wenzel, K. Ladunga, K. Samu, I. Langer, F. szőke: Pseudo-Isochromatic Plates for Measuring the Ability to Discriminate Colours. 21st symposium of the International Colour Vision Society, ICVS(2011)
Acta Polytechnica Hungarica Vol. 9, No. 2, 2012
Pseudo-Isochromatic Plates to Measure Colour Discrimination
Klára Wenzel, Krisztián Samu
Budapest University of Technology and Economics
Department of Mechatronics, Optics and Information Engineering
Bertalan L. u. 4-6, 1111 Budapest, Hungary
Abstract
We have developed 3 series of pseudoisochromatic plates for colour vision testing. The plates are arranged in order of increasing difficulty. In the first (red/green) series, a red Landolt C is shown in front of a green background. This series is used to determine the severity of colour vision deficiency. In the second series, colours are located on the protan confusion line, whereas in the third series, on the deutan confusion line. The plates were printed by a calibrated colour printer, then bound in a book. The plates were used to test 320 persons with colour vision deficiency and 20 ones with normal colour vision. Our results showed a 96.25% efficiency in separating colour anomals and colour normals as verified by an anomaloscope. The test book gives prompt results and it is fun to use. A test takes about 5 minutes so it is suitable for mass tests and moreover, it may also be used to test the colour vision of children.
Keywords: colour vision deficiency; anomaloscope; ishihara test; D15 test
1. Introduction
1.1 An Optical Explanation of Colour Vision Deficiency
Daytime vision is made possible by the approximately 6.8 million photoreceptors (also known as the cones) found in the retina – the interior part of the eye. Some of the photoreceptors are sensitive to the colour red, others to green, and a third group is sensitive to blue. A person can distinguish between and identify more than a million different colours through the degree of stimulation of the three spectrally sensitive receptor groups. The English terms for the receptors sensitive to red, green and blue colours are: long wave, middle wave and short wave sensitive receptor, or L, M and S, for short. Wave-length determined spectral sensitivity is indicated by l(λ), m(λ) and s(λ) [12], (Fig. 1). In medical literature, these receptors are named protos, deuteros and tritos. Colour vision relying on the K. Wenzel et al. Pseudo-Isochromatic Plates to Measure Colour Discrimination three types of receptor is called trichromatic vision. The most common forms of colour vision deficiency are protanomaly (the anomaly of the L receptor) and deuteranomaly (the anomaly of the M receptor), [12]. We developed our colour boosting eyeglasses for these types of colour vision deficiency. In protanomaly and deuteranomaly, the spectral sensitivity curves of the L and M receptors, respectively are different from those seen in people with normal colour vision. The difference is a shift of the curves along the wavelength axis. The cause of this difference are genetic: different L and M photopigment alleles code for different amino acid sequences, and some differences in the amino acid sequences of the photopigments result in differences in their peak sensitivities. The diagram in Fig. 2 illustrates the altered spectral sensitivity in people with protanomaly. The continuous lines show the spectral sensitivity curves of daytime receptors in the case of normal colour vision (l(λ), m(λ) and s(λ)), while the dashed lines show the spectral sensitivity curve of a person with protanomaly l’(λ). We can see that protanomaly is caused by the protos spectral sensitivity being shifted toward shorter wavelengths and thus being closer to the sensitivity of the deuteros than happens in subjects with normal colour vision. Fig. 3 illustrates the spectral sensitivity of the deuteranomalous receptor. In this case, the spectral sensitivity of the deuteros is shifted toward longer wavelengths, and is found closer to the sensitivity of the protos than in subjects with normal colour vision.
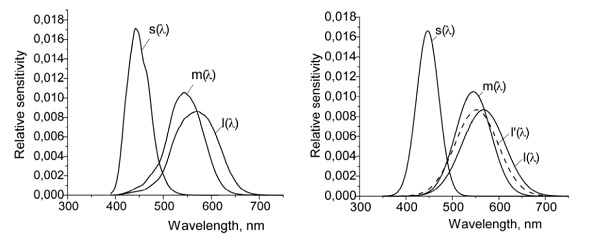
| Figure 1 Spectral sensitivity curves of the three daytime receptors of those with normal colour vision, as function of wavelength [Gegenfurtner, Sharpe, 1999]. In the picture l(λ) means the spectral sensitivity of the long wave, m(λ) of the middle wave and s(λ) of the short wave sensitive receptors adapted for white light. |
Figure 2 The diagram illustrates the spectral sensitivity disorder in people with protanomaly. The continuous lines show the spectral sensitivity curves of daytime receptors in the case of normal colour vision (l(λ), m(λ) and s(λ)), while the interrupted line shows the spectral sensitivity curve of a person |
The ability to discriminate between hues in the red-green segment of the spectrum is due to the different sensitivities of the L and M pigments. In protanomaly, as well as in deuteranomaly, the spectral distance between the L and M pigments is reduced compared to people with normal colour vision. Therefore, the ability to distinguish between red and green hues is impaired in both cases; this is the reason for sub-normal red-green colour vision. Correspondingly, colour identification is also impaired: the anomalous L and/or the anomalous M pigments are not sufficiently sensitive to red-green differences. Instead, the sensitivity to yellow hues dominates in the middle-to-long end of the spectrum. The impairment characteristic of protanomaly is shown by the protan confusion line, whereas that of deuteranomalous people by the deutan confusion line in the CIE xyY system (Fig. 4). Colour vision deficiency is tested in most cases by anomaloscopes, the original form of which was constructed by the well-known mathematician Lord Rayleigh, and by different types of pseudo-isochromatic plates.
1.2 Our New Colour Vision Test
Our objective was to develop a colour vision test as simple and effective as the Ishihara test yet as accurate as an anomaloscope, providing quantifiable results. We also aimed at developing a prompt, simple method, also suitable for testing children.
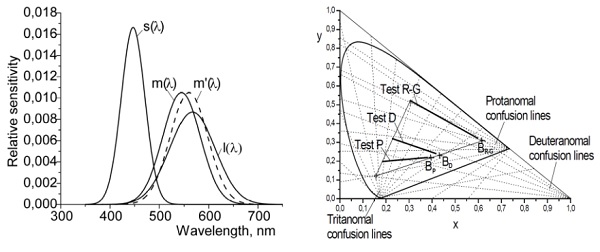
| Figure 3 The diagram illustrates the spectral sensitivity disorder in people with deuteranomaly. The continuous lines show the spectral sensitivity curves of daytime receptors in the case of normal colour vision (l(λ), m(λ) and s(λ)), while the interrupted line shows the spectral sensitivity curve of a person with deuteranomaly m’(λ). |
Figure 4 Points of the pseudoisochromatic plates in the CIE xyY chromaticity space. Test R-G, Test P, Test D and are the points of the plates in the three (R-G, P and D) series, B R-G, BP and BD are the points of the background in the series. |
There are some excellent colour vision tests that comply with these criteria [1, 2, 3, 4, 5, 6, 7, 8, 9, 10, 11]. However, we wished to develop a test that could be abl to distinguish 15 levels according to the severity of colour vision deficiency. Our test was composed series of pseudoisochromatic plates. These plates do not show numbers or letters but Landolt C-s in various positions. The method was tested on 320 persons with colour vision deficiency and 20 ones with normal colour vision. These test persons had first been tested by the Ishihara test and anomaloscope. The criteria for diagnosis were developed according to the histograms of the measured results. The efficiency of separating patients with colour vision deficiency from those with normal colour vision was 96.25%.
2. Methods
The pseudoisochromatic plates were designed using the principles described in the book of J. Birch [12]. The pseudoisochromatic plates were designed in the colour system of CIE Lab, by a software that utilises confusion lines. The coloured dots on the plates are circular, and their density and sizes are similar to those in the Ishihara images. Both the Landolt-C and the background are composed of dots of 3 shades of the
same colour.The plates are arranged in order of increasing difficulty. In the first (R/G) series, a red Landolt C is shown in front of a green background. This series measures the ability to discriminate green and red colours. In the second (P) series, colours are located on the protan confusion line whereas in the third (D) series, on the deutan confusion line. Plates in the R/G series are coded as 300, 280, 260, etc. down to 60, 40, 30, 20. Plates, and in the P and D series they are coded as 200, 180, 160, etc. down to 60, 40, 30, 20. In each series, the first plate is readily identifiable; that is, there is a pronounced difference between the average colour of the Landolt-C and the average colour of the background. This difference was determined in accordance with previous experiences, in a way that anomalous trichromats could identify the plate while dichromats could not (E*a,b=60…80). The other plates in the series are arranged in order of increasing difficulty. While the colour of the background remains the same, the colour of the Landolt-C gradually merges into the background. The last, most difficult plate may be identified only by those with excellent colour vision (E*a,b=8). The average lightness of the Landolt C and its background is the same in every Image. The test was initially developed for a colour computer screen [13, 14, 15, 16, 17, 18, 19, 20] and eventually we switched to a printed version [21].
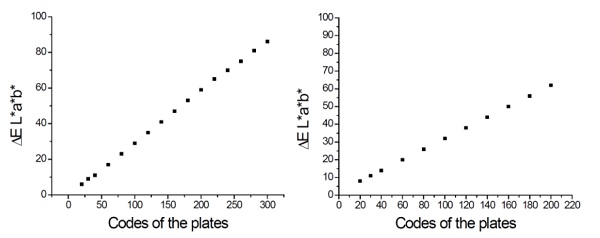
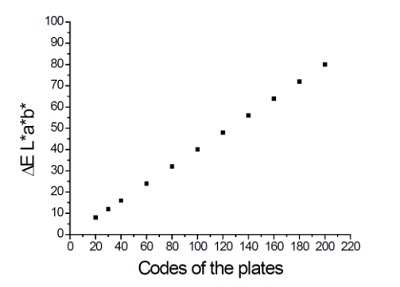
Plates were printed by a Canon iX5000 inkjet colour printer. While printing, the consistency of colour stimuli was provided by means of the ICC Color Management system. Printing as well as using the plates is defined for a CIE D65 standard illuminant. The examination must be conducted with a standard CIE D65 illuminant. Lighting must be diffuse, neither too dark, nor blindingly bright; the ideal is 400…800 lux. There should not be a blinding light source directed at the subject, and neither must the light be in such a way that a glare could disturb the subjects when observing the images [22, 23]. The plates are bound in a book. The book is designed in a way that the test person is able to see one plate at a time only, while the white backside of the next page provides white adaptation for the test person. Once printed, the colours of plates were verified by Datacolor Microflash 45 (SN:Z151634, White reference: Techkon MF 45.812001). In each plate, 5 ones of the largest dots were measured from the groups of light, medium and dark dots each, then the colours of the background and the Landolt-C were determined from their averages in the CIE xyY system (Fig. 4). As is illustrated by the figure, the colour dots on the plates are near the confusion lines. We also determined the E*a,b difference between the colours of the Landolt-C and the background for each plate (Figs. 5, 6 and 7). This difference gradually decreases from plate to plate.
3. Tests
The colour vision of 320 persons with colour vision deficiency and 20 ones with normal colour vision was tested by various methods: anomaloscopy, Ishihara test and the new pseudoisochromatic plates. The test persons were all males, between 8 and 59 years; the average age of the test persons was 29.67 year. The group of persons with colour vision deficiency was composed of 158 protanomalous and 162 deuteranomalous persons. The test persons cannot be considered as a representative sample of the colour blind as the tests were completed on volunteers. A standard CIE D65 light source of 600-800 lux was applying for performing the tests.
3.1 Instruments Used
1) Oculus HMC anomaloscope (Typ. 47700, SN 24119901, Germany).
2) Ishihara Tables (ISHIHARA’S TESTS FOR COLOUR DEFICIENCY, 24 Plates Edition, 1999, Kanehara &CO., Tokyo, Japan). The plates were in good condition.
3) Color Vision Test, III. Edition, Printed in 2009.
3.2 Measured Results
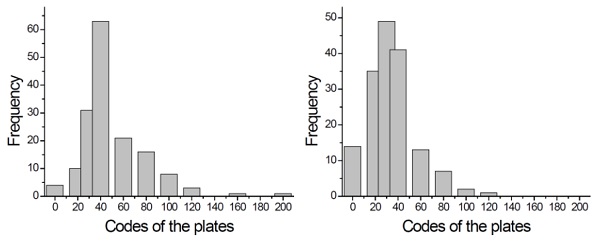
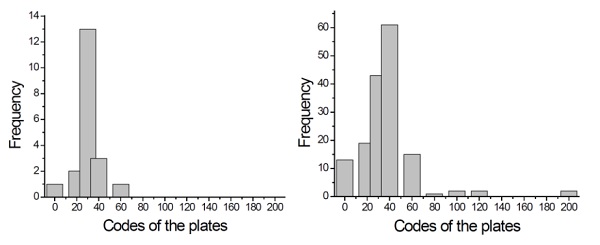
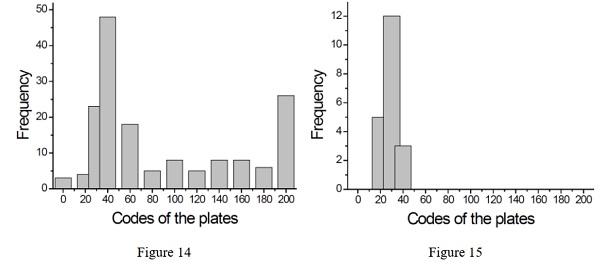
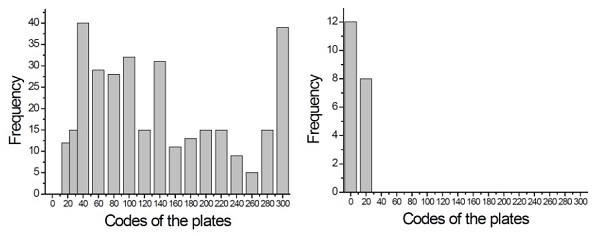 A measured result is defined as the code of the first plate the test person was not able to identify in the series of plates of increasing difficulty. Measured results are first given in the form of histograms. As anomaloscope and the Ishihara test confirmed all the 320 test persons as colour blind, the histograms show the frequency of the results of the new test only. Fig. 8 shows the results of the R/G series of the test, divided as the measured results for those with colour vision deficiency and Fig. 9 shows the results for control group. On the horizontal axis, the codes of the plates are displayed whereas the vertical axis gives the number of test persons who were not able to identify the orientation of the Landolt-C in the given plate. Fig. 10 shows the results of the P series of the test for protanomals, Fig. 11 for deuteranomals and Fig. 12 those with a normal colour vision. Protanomals regularly scored lower than deuteranomals in this series. Fig. 13 shows the results of the D series of the test for protanomals, Fig. 14 for deuteranomals and Fig. 15 those with a normal colour vision. Protanomals regularly scored better than deuteranomals in this series. 3.3 Distinguishing Persons with Colour Vision Deficiency from Those with Normal Colour Vision Persons with colour vision deficiency are distinguished from those with normal colour vision using the R/G series. Out of the 20 persons with normal colour Vision, 12 ones successfully identified all the plates whereas 8 persons could not identify plate 20. Plates with higher code numbers (30, 40, etc.) were readily identified by everybody in the control group.
Accordingly, colour vision deficiency is defined as the inability to identify the plate coded as R/G=30. However, 12 persons out of the 320 test persons with colour vision deficiency were able to identify plate R/G=30, as Fig. 8 clearly illustrates. It means that the results of the test differed from those measured by anomaloscopy in 12 cases; that is the probability of anomaloscopy and the new test yielding the same result is P=((320-12)/320)x100=96.25%. It should be noted, however, that the ability of discriminate colours deteriorates with age. Our tests were completed on young persons, mostly under 30. Older people or those with impaired vision will not be able to identify plate R/G=40, maybe even plate R/G=60. A possible solution to this problem is to record the codes of the first plates the test person was not able to identify in both the P and D series and consider these values when determining colour vision deficiency using the R/G series. For protanomalous persons, consider the lowest D value, whereas for deuteranomalous ones, the lowest P value.
 3.4 Distinguishing Protanomals and Deuteranomals
The recommended criteria for distinguishing protanomals and deuteranomals are as follows: A person should be considered protanomalous, if P/D>0.9, if not than deuteranomalous. Our results indicated 124 persons as protanomalous, out of the 158 protanomals as verified by anomloscopy. It means anomaloscopy and the new test yielded the same result in 78.48% of the cases. A person should be considered deuteranomalous, if P<D during the tests. Our results indicated 116 persons as protanomalous, out of the 162 protanomals as verified by anomloscopy. It means anomaloscopy and the new test yielded the same result in 71.60% of the cases. Average of results of the measures is 75%
4. Results
The new R/G series of the pseudoisochromatic plates yielded the same results as anomaloscope in 96.25% of the cases. The test was able to distinguish 16 levels according to the severity of colour vision deficiency. The test was able to distinguish protanomaly from deuteranomaly in 75% of those cases that were verified by anomaloscope. This difference is probably due to the fact that anomaloscope relies on monochromatic light whereas the new test applies K. Wenzel et al. Pseudo-Isochromatic Plates to Measure Colour Discrimination colours in a broad range, thus the individual variances in the curves of conesensitivity of the test person manifest in a different way.
Conclusions
The new test detects colour vision deficiencies with an efficiency of 96.25%, distinguishes protanomaly from deuteranomaly at 75% confidence and is able to distinguish 15 levels according to the severity of colour vision deficiency. Completing the test takes about 5 minutes while analyzing the results takes only a minute. Thus, the method is suitable for mass tests. The test is not exhausting; on the contrary, it is fun to use, and moreover the method is suitable to test illiterate children.
Acknowledgement
This work is connected to the scientific program of the " Development of qualityoriented and harmonized R+D+I strategy and functional model at BME" project. This project is supported by the New Széchenyi Plan (Project ID: TÁMOP- 4.2.1/B-09/1/KMR-2010-0002).
References
[1] City University Online Colour Vision Test, web-based colour vision test
[2] City University Online Colour Vision Test, in print version
[3] Dvorine Pseudoisochromatic Plates, The Psychological Corporation,Harcourt
[4] Farnsworth D15 Test
[5] Hardy, Rand and Rittler: HRR Test, American Optical Co.
[6] Ishihara Tests for Colour Deficiency, Kanehara & Co, Ltd. Tokyo, Japan,1985
[7] Neitz, J., and Neitz, M.: Neitz Test of Colour Vision, Western Psychological Services, 1988
[8] Rabkin, E. B.: Polichromatitseskie Tablicü dlja issledovania svetooshushenia, Medicina, Moscow, 1971
[9] Velhagen, K. and Broschmann, D: Tafeln und Prüfung des Farbensinnes 12031 Wilshire Blvd, Los Angeles,CA 90025-1251, 2001
[10] Regan BC, Reffin JP & Mollon JD. Luminance Noise and the Rapid Determination of Discrimination Ellipses in Colour Deficiency. Vision Research, 34, 1994; pp. 1279-1299
[11] J D Mollon, J P Refin: A Computer-controlled Colour Vision Test that Combines the Principles of Chibret and of Stilling, R.C.S. MEETING, 1989
[12] Birch J.: Diagnosis of Defective Colour Vision. Brace & Company, San Antonio, 1993
[13] K. Wenzel, I. Kucsera: Chromatic Adaptation Testing with a Computer Graphics System, 10th International Conference of Women Engineers and Scientists, Bp. 1996
[14] Ladunga K., Wenzel K.: New Colour Vision Test on Monitor, XVth ICVS Symposium,Göttingen, 1999
[15] Ladunga K., Kucsera I., Wenzel K.: If I were Colour Blind, CIE Symposium ’99, Budapest, 1999
[16] Wenzel K., Ladunga K., Ábrahám Gy., Kovács G., Kucsera I., Samu K.: Measuring Colour Resolution of the Eye by Using Colour Monitors, Colour and Visual Scales Conference, London, 2000
[17] M Piazol, N A Zanc: Medical Tourism - A Case Study for the USA and India, Germany and Hungary, Acta Polytechnica Hungarica Vol. 8, No. 1, 2011
[18] Samu K, Wenzel K, Ladunga K: Colour and Luminance Contrast Sensitivity Function of People with Anomalous Colour Vision, AIC Conference, Rochester, 2001 June 24-29, Proceedings of SPIE Volume 4421
[19] K. Wenzel, K. Ladunga, K. Samu: Measurement of Colour Defective and Normal Colour Vision Subject’s Colour and Luminance Contrast Threshold Functions on CRT, Periodica Polytechnica, Vol. 45, No. 1, pp. 103-108, 2001
[20] K Samu, K Wenzel: Presenting Surface Colours on Computer-controlled CRT Displays, Facta Universitatis (NIS), Ser.: Elec. Energ. Vol. 16, 2003, pp. 177-183
[21] Wenzel K, Ladunga K, Samu K, Langer I and Szőke F. PseudoIsochromatic Plates for Measuring the Ability to Discriminate Colours. 21st Symposium of the International Colour Vision Society, 2011
[22] Pokorny J, Smith VC, Verriest G & Pinckers AJL. Congenital and Acquired Colour Vision Defects. Grüne & Stratton, New York, 1979
[23] Balázs Vince Nagy, György Ábrahám: Spectral Test Instrument for Colour Vision Measurement, Journal of Bionics Engineering, Vol. 2, pp. 75-79, Issue 2, 2005
[24] Klara Wenzel: Regular Wear of Coloured Glasses Improved the Symptoms of Colour Vision Deficiency, International Journal of Innovative Studies in Sciences and Engineering Technology (IJISSET), ISSN 2455-4863, www.ijisset.org Volume: 6 Issue: 5 | 2020, IJISSET Page 46 Volume: 6 Issue: 5 | 2020, IJISSET Page 46
